I’m a very, very amateur hockey analytics guy, if fact this is the first time I’m going to dip my toe in the water. And I think the work that’s been done is interesting in that it’s proven that much of hockey is, well, luck and randomness (which isn’t that much different from baseball in some respects). Sure there is a ton of skill, and most goals come from skill and/or breakdowns either mentally or tactically, but the more you think about luck and randomness in hockey, the more you focus on goofy goals.
Take the Hawks third goal in Game One. Oduya took a shot from blue line, it appeared to be going just wide, then went of a Boston’s player skate and into the net. Tie game. Rask gets a goal against thanks mainly to bad luck. Obviously there is skill on the Hawks part on that play, Oduya’s shot was hard and low, and the Hawks at that point in the game were taking a ton of shots. If you are skillful enough to take enough shots (either on target or not), luck and randomness will eventually happen and you’ll get a ‘garbage’ goal from time to time. I don’t think shooting for the sake of shooting is a great stradgy, but lots of shots, good and bad, will yield goofy goals. And it did on that play.
And that brings me to this point: the narrative seems to be that Rask, who is playing out of his mind, will probably continue to do so since he’s been doing it. It’s a fallacy... the old past performance will equal future performance. So that’s what I set out to find... not if he can keep this up, but how out of his mind has he been?
I went back and looked at every game that Rask has played in this year. I wanted to keep this simple because I was more looking for trends than some sort of predictive analysis. So I just took the result, goals against, shot attempts, shots saved, save percentage and shutouts. I’ll add all this at the bottom.
Descriptive Statistics
| |||||
Rask
|
N*
|
Minimum
|
Maximum
|
Mean**
|
Std. Deviation
|
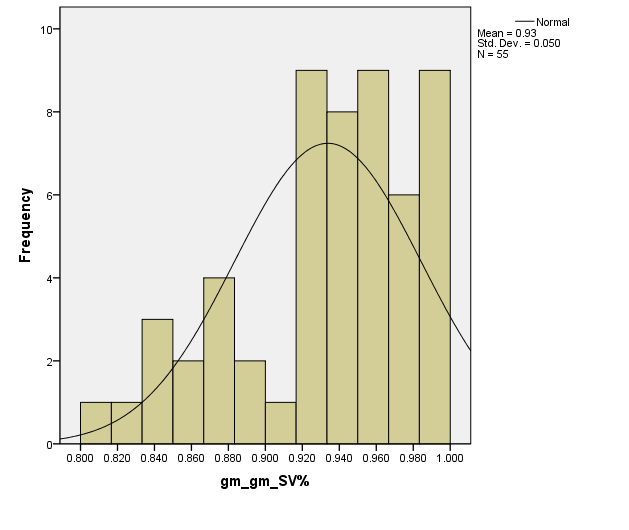
gm_gm_SV%
|
55
|
.806
|
1.000
|
.93376
|
.050492
|
Valid N (listwise)
|
55
|
*I included all games played, so there’s a huge outlier which is a 2 shot, 2 save, 100% save percentage against the Leafs
**Rask’s save percentage, playoffs and regular season, is actually 0.9356. The mean is the average of all his game-by-game save percentages, just to avoid any confusion.
And something important to consider when looking at his game-by-game results: Rask can’t have a performance that’s two standard deviations better from the mean. It’s impossible because he can’t save more than 100% of the shots he faces.
The histogram proves this standard deviation issue. Someone with much better stat skills than myself can make this fit better and probably take something away from this. But to me, the game-by-game stuff doesn’t really tell me anything other than, sometimes he’s really good, sometimes he’s bad, most of the time he’s pretty good. I threw in a normal distribution curve just to show how misleading they can be.
This scatter plot, in order of games played this year, shows that too, however, you do see some clustering of games that are higher up as the season progresses here... those would be the playoffs:
Scatter plot of Rask’s Save Percentage, By Game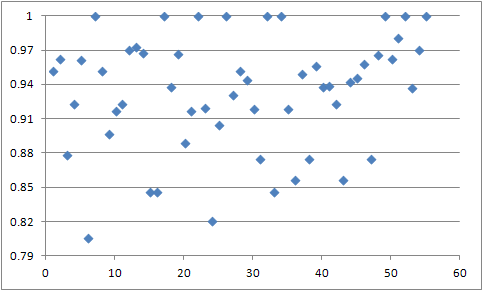
However, the clustering isn’t is prolific... you see a lot of game-to-game variance over all. Rask followed up his shutouts in the regular season with fairly ‘blah’ games. That hasn’t been the case in the playoffs.
This sort of randomness then lead me to this... what if I tracked a trailing five game performance. So basically all I did was add up the shots attempted, shots saved, and the saver percentage over five games (total, not average), starting with game five of the season and continuing through Game 3 of the Cup Finals.
Scatter Plot of Rask’s Trailing Five-Game Save Percentage
Ah... something interesting is happening here. We clearly see the trend of improved play. In fact, Rask’s five best five game stretches have all happened in the playoffs and seven of ten in all.
Here’s the histogram, again with a normal distribution which appears to be a better fit, however, I’m pretty sure it’s not the best fit, so it’s more there for reference than anything else (i.e. if you for some reason hand this in for a stats class, you’ll probably fail for including it).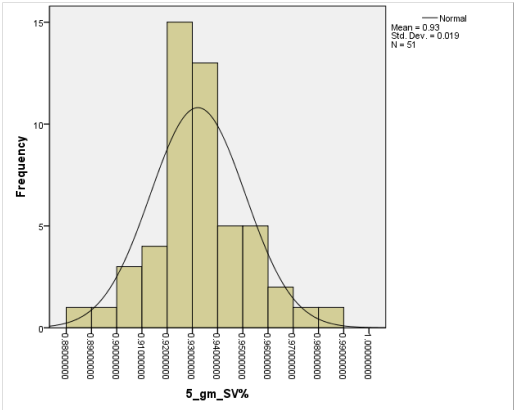
But what this does show is that over any five-game stretch, Rask has been right around .930/.940 save percentage. We see some poor performance, and we see some great performance, again, almost all of those being in the playoffs.
Here’s the min, max, mean and std. deviation for those trailing five games
Descriptive Statistics
| |||||
Rask
|
N
|
Minimum
|
Maximum
|
Mean
|
Std. Deviation
|
5_gm_SV%
|
51
|
.88659793
|
.98181820
|
.9321673671
|
.01882799865
|
Valid N (listwise)
|
51
|
The mean, as you’d expect, isn’t far from his over all save percentage (all games: 0.9356).
Rask’s two best five game stretches (the Games 1-3 against the Hawks and Games 3-4 vs the Pens; Game 5 vs the Rangers + Games 1-4 vs Pens) have been phenomenal. However, he’s been two standard deviations (nearly three!) above the mean in those stretches. I realize there’s overlap here (Games 3 and 4 vs the Pens specifically), but the main takeaway is that what Rask is doing right now he can’t keep up.
HOWEVER, that also doesn’t matter very much seeing that the Bruins only need to win two more games, and at most, can only play four more games this season. It’s possible that Rask’s continues this high level of play and any sort of regression won’t occur until after this season is over. As a Hawks fan, I hope that isn’t the case.
And as it’s been pointed out everywhere... not all shots are created equal. Rask making a 40 foot save makes the numbers look better because he’s going to make that save 99.9% of the time. And the Hawks have launched a lot of shots, but a lot of them have been clean, easy to see 30 or 40 footers from the boards.
But at the same time... there’s Odyua’s shot that I talked about at the start of this now novel. They don’t go in often, but if you’re attempting 100 or more shots in a game, like the Hawks did in Game One, some of those go in because of randomness. When you consider the number of shots the Hawks are attempting (I'm taking Corsi and Fenwick here), it should make Boston fans a little bit uncomfortable. The Hawks have out Corsi the Bruins in all three games (in Game Three the Bruins were positive in Fenwick, but were negative in Corsi). The sheer number of attempts the Hawks are taking, combined with Rask's long-term unsustainable save percentage, is a positive for the Hawks.
To tie this to the Sox... remember how the Sox had like a 57 game lead in July in 2005? Then all of a sudden, on September 20 or so, the Indians had pulled to within a game? That was because the Indians won like 19 out 20 or something insane like that... and through it all I kept saying to anyone that would listen... Cleveland can’t keep this up, they’ll start losing more eventually. And they did. The rest is history.
That’s how I’m starting to feel about Rask... he can’t keep a .971 save percentage forever. Hopefully he falls back to his normal .935 starting tonight. But the Sox in ‘05 had plenty of time... the Hawks don’t. And Rask probably doesn’t need to be great to win two more games.
Two quick things:
1) I have no clue how Crawford’s trends would look, but I realize he’s been nearly as good and it can easily be argued that he’s just as likely to fall back to earth over the next few games.
2) The Hawks would have scored 8 goals in this series if Rask was stopping shots at his ‘season’ average. Granted, Game One really throws things out or whack... so does throwing 40 foot shots and not getting much of anything going on the power play...
BACK TO THE SOX LATER
Here is the trailing five game info I talked about in a google doc.
No comments:
Post a Comment